REDC CONCEPTLAB · REPRESENTATIVE SCENARIO
From site potential to an investment story.
An English overview of the existing ConceptLab sample project, using the same inputs and financial calculation engine.
Illustrative scenario only: site, planning, market and infrastructure assumptions are not verified information about an actual property. Financial outcomes depend on these assumptions and are not investment advice.
Print or save this English overview as a PDF using your browser.
EXECUTIVE SUMMARY · INVESTMENT POTENTIAL
ConceptLab Investment Score
Illustrative assessment using the same score calculation and sample inputs as the Turkish report.
Provisional score: infrastructure is excluded until sufficient utility evidence is available; the remaining weights are normalized to 100%. The ConceptLab Investment Score differs from the investment decision score. All sample market and location inputs are illustrative, not verified live data; this assessment is not investment advice.
01 · DEVELOPMENT CAPACITY
Site and planning assumptions
FAR refers to the floor area ratio (emsal). Here, GFA refers to the gross construction area included in FAR (emsale dahil inşaat alanı). Definitions vary by jurisdiction; these values are illustrative, not official planning rights.
SITE & PLANNING · REPRESENTATIVE SCENARIO
Planning inputs and area calculations
These inputs demonstrate the same calculations as the Turkish sample; they do not describe official planning rights for a real site.
Illustrative setbacks
Area schedule
| Area | Sample amount | Calculation or assumption |
|---|---|---|
| GFA included in FAR | 36,000 m² | Site area × FAR |
| Saleable area | 46,800 m² | Site area × FAR × common area factor |
| Enclosed parking | 15,000 m² | 600 spaces × 25 m² |
| Technical, storage and shelter | 4,140 m² | Technical / storage: 2,340 m²; shelter: 1,800 m² |
| Total construction area | 65,940 m² | Saleable area + parking + technical / storage / shelter |
FAR is the floor area ratio; GFA here means the gross construction area included in FAR. Areas, setbacks and parking assumptions are illustrative and require independent planning confirmation.
02 · PROJECT MIX
Proposed uses
| Use | Saleable area | Indicative sale price | Indicative unit cost |
|---|---|---|---|
| Residential | 30,000 m² | USD 4,800 / m² | USD 1,350 / m² |
| Office | 10,000 m² | USD 3,600 / m² | USD 1,250 / m² |
| Street retail | 6,800 m² | USD 6,500 / m² | USD 1,400 / m² |
Prices and costs are scenario assumptions, not verified market offers.
03 · FEASIBILITY
Financial overview
Unlevered project model including the selected purchase price of USD 42,000,000. Calculations use the same sample inputs and feasibility engine as the Turkish report.
Project NPV is unlevered; it is not the financed equity NPV shown in some investment decision views. Actual results are uncertain.
Annual project cash flow
RevenueCost including land
2027
USD 56,917,512 cost
USD 0 revenue
USD 56,917,512 cost
2028
USD 34,807,528 cost
USD 22,420,000 revenue
USD 34,807,528 cost
2029
USD 34,807,528 cost
USD 56,050,000 revenue
USD 34,807,528 cost
2030
USD 14,917,512 cost
USD 89,680,000 revenue
USD 14,917,512 cost
2031
USD 0 cost
USD 56,050,000 revenue
USD 0 cost
| Year | Revenue | Cost | Net cash flow |
|---|---|---|---|
| 2027 | USD 0 | USD 56,917,512 | USD -56,917,512 |
| 2028 | USD 22,420,000 | USD 34,807,528 | USD -12,387,528 |
| 2029 | USD 56,050,000 | USD 34,807,528 | USD 21,242,472 |
| 2030 | USD 89,680,000 | USD 14,917,512 | USD 74,762,488 |
| 2031 | USD 56,050,000 | USD 0 | USD 56,050,000 |
04 · SITE SCREENING
Topography and infrastructure
Indicative slope
8% average slope; 12 m illustrative elevation difference. Measurements are assumptions and the section is not to scale.
Infrastructure
Utility access and capacity are illustrative assumptions. Written confirmation from the relevant utility providers is required, including for electricity capacity and transformer needs.
Access and amenities
The sample assumes a transit stop at 250 m and a rail connection at 700 m. Distances and destinations are illustrative.
05 · CONCEPT DEVELOPMENT
Visual concepts and unit plans
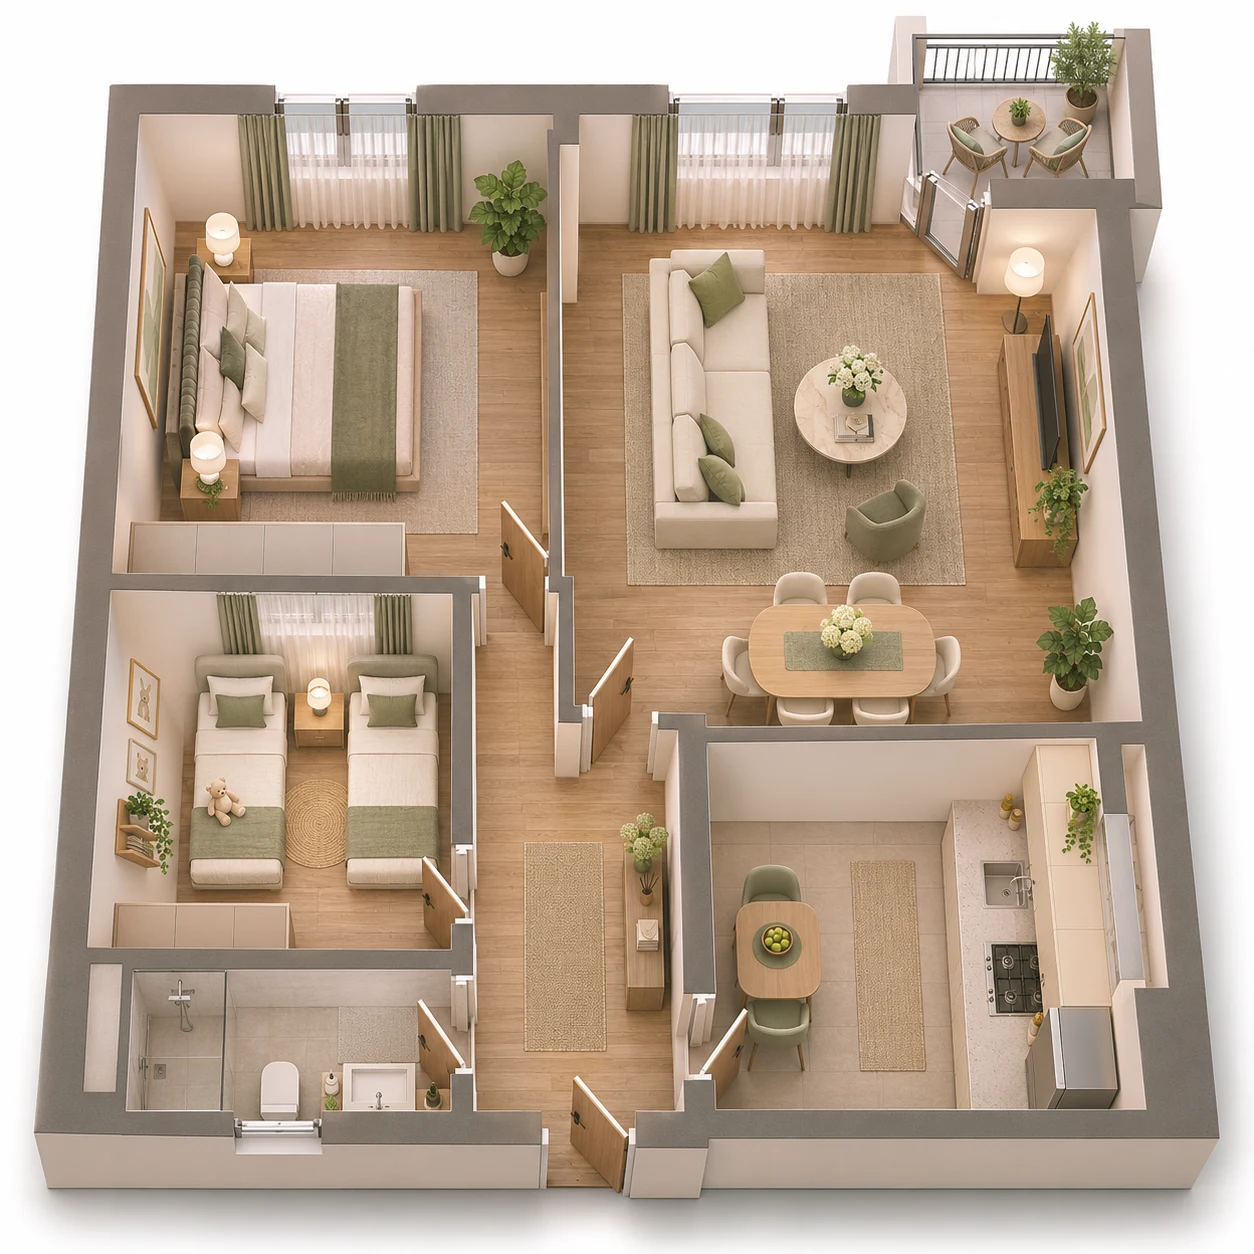
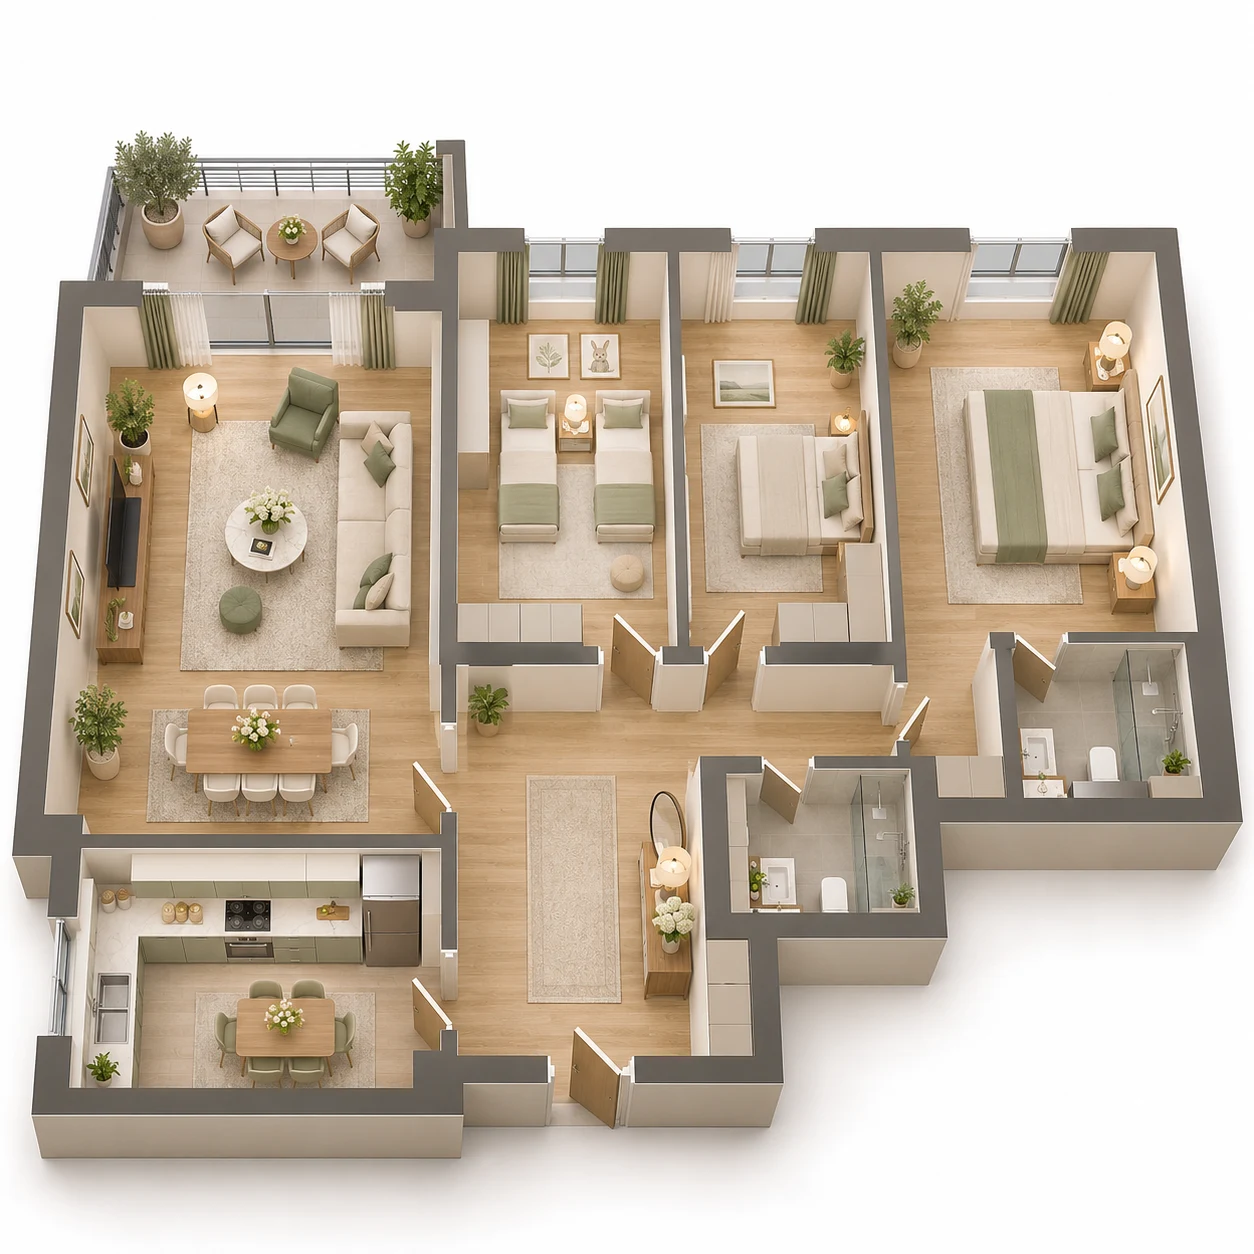
Indicative concepts and furnished plans for communicating the development idea; not architectural or construction documents.

06 · MARKET & AUDIENCE
Market and target audience
Illustrative prices and positioning assumptions help demonstrate how the project mix can be considered against its intended audience. They are not live market data or verified transactions.
Residential pricing
Sample model assumption: USD 4,800 / m². Illustrative comparable ranges: USD 4,400–5,000 / m² and USD 4,600–5,200 / m².
Target profile
Illustrative B+ positioning, focused on upper-middle-income families and regional professionals. The sample audience score is not the ConceptLab Investment Score.
Product strategy
Residential, office and street retail are combined around a pedestrian-oriented courtyard; 2+1 and 3+1 units form a principal part of the illustrative residential mix.
MARKETING · REPRESENTATIVE SCENARIO
Marketing and sales programme
The illustrative strategy positions the mixed-use project around a pedestrian-oriented living environment for families and professionals.
Active sales channels
DigitalCorporate real estate networkSales office
Launch and sales phases
| Phase | Year | Sales allocation | Illustrative objective |
|---|---|---|---|
| Pre-launch demand | 2028 | 10% | Test market demand |
| Launch | 2029 | 25% | Initial sales |
| Main sales | 2030 | 40% | Sales alongside construction progress |
| Handover | 2031 | 25% | Remaining inventory |
Timing, sales shares, budget and channels are illustrative assumptions, not a sales forecast or verified market demand.
CONCEPT DESIGN · REPRESENTATIVE SCENARIO
Concept design decisions
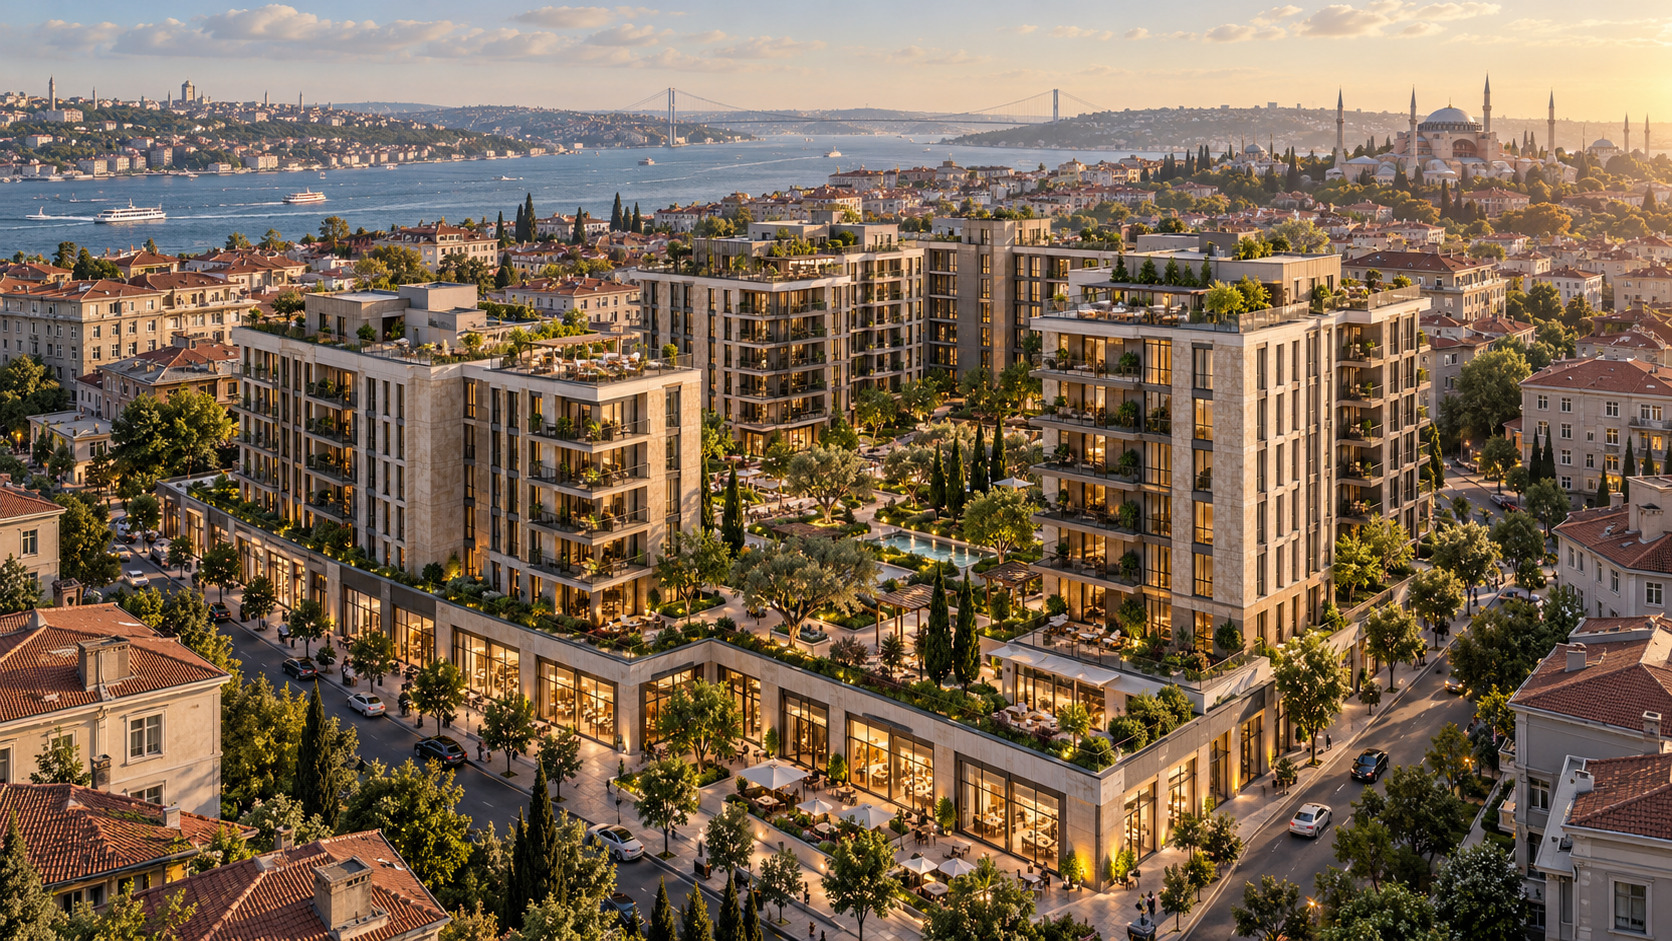
The selected example combines residential, office and street retail uses around a pedestrian-oriented courtyard. The development programme and images are illustrative.
The concept fit score uses the same screening calculation as the Turkish example. It reflects available scenario inputs, including whether a floor count and parcel outline are provided; it does not verify zoning compliance, architectural design, sustainability performance or an actual site's suitability. It is distinct from the ConceptLab Investment Score.
| Screening criterion | Points |
|---|---|
| Planning input | 30 / 30 |
| Parcel outline | 20 / 20 |
| Slope assessment | 16 / 20 |
| Target audience | 15 / 15 |
| Project programme | 15 / 15 |
Illustrative design brief
| Design element | Sample assumption |
|---|---|
| Development strategy | A balanced mix of residential, office and retail |
| Block arrangement | 4 illustrative blocks |
| Layout | Around a landscaped courtyard |
| Architectural style | Contemporary |
| Façade | Natural stone and glass |
| Landscape | Pedestrian-oriented courtyard |
| Sustainability ideas | Shading and water efficiency |
Concept alternatives
Images communicate a development idea; they are not verified designs or construction documents. Planning requirements and technical feasibility need independent confirmation.
DEVELOPMENT PROGRAMME · REPRESENTATIVE SCENARIO
Detailed area programme
The same illustrative area schedule shown in the Turkish project mix. GFA below refers to construction area included in FAR.
| Use | GFA included in FAR | Saleable area | Parking | Technical, storage and shelter | Total area |
|---|---|---|---|---|---|
| Residential | 23,077 m² | 30,000 m² | 10,000 m² | 2,700 m² | 42,700 m² |
| Office | 7,692 m² | 10,000 m² | 3,000 m² | 900 m² | 13,900 m² |
| Street retail | 5,231 m² | 6,800 m² | 2,000 m² | 540 m² | 9,340 m² |
| Total | 36,000 m² | 46,800 m² | 15,000 m² | 4,140 m² | 65,940 m² |
Total area combines saleable, parking, technical and shelter areas; GFA is shown separately and is not added again. These are scenario assumptions, not approved plans.
SITE SCREENING · ASSUMPTIONS
How the slope estimate is calculated
The sample assumes a 150 m horizontal distance: 12 m elevation difference ÷ 150 m × 100 = 8%. These figures are illustrative, not surveyed measurements; the section is not to scale.
MARKET · REPRESENTATIVE AUDIENCE
Target audience assessment
The sample positions the residential offer for upper-middle-income families and regional professionals. The following scores are illustrative assessments from the sample, not independent market research.
| Assessment criterion | Score | Scenario context |
|---|---|---|
| Transport and access | 8 / 10 | Assumed rail and bus access. |
| Family living | 8.5 / 10 | Planned courtyard and shared spaces. |
| Price and product balance | 7 / 10 | The example pricing requires market verification. |
The audience score is a separate measure and should not be confused with the ConceptLab Investment Score.
COST & REVENUE · REPRESENTATIVE SCENARIO
Development cost and revenue by use
The breakdown follows the same sample feasibility model. Amounts are illustrative assumptions in US dollars.
| Cost component | Amount | Share of total cost |
|---|---|---|
| Function construction | USD 62,520,000 | 44.2% |
| Parking, technical and shelter construction | USD 12,441,000 | 8.8% |
| Other development allowance | USD 5,996,880 | 4.2% |
| Indicative site-work allowance | USD 11,244,150 | 7.9% |
| Marketing | USD 3,500,000 | 2.5% |
| Contingency | USD 3,748,050 | 2.6% |
| Selected land purchase price | USD 42,000,000 | 29.7% |
| Total cost including land | USD 141,450,080 | 100% |
Site-work allowance is a preliminary slope-based screening estimate, not a measured bill of quantities. Additional utility connection assumptions shown elsewhere in the report are separate screening information and should not be added again without checking for overlap.
Modelled revenue by use
| Use | Saleable area | Indicative revenue | Share of total revenue |
|---|---|---|---|
| Residential | 30,000 m² | USD 144,000,000 | 64.2% |
| Office | 10,000 m² | USD 36,000,000 | 16.1% |
| Street retail | 6,800 m² | USD 44,200,000 | 19.7% |
PRODUCT MIX · REPRESENTATIVE SCENARIO
Residential unit mix
The sample combines 325 illustrative apartments. Areas are assumptions and do not represent approved architectural plans.
| Unit type | Units | Indicative area per unit | Combined area | Share of units |
|---|---|---|---|---|
| 1+1 | 100 | 60 m² | 6,000 m² | 30.8% |
| 2+1 | 150 | 90 m² | 13,500 m² | 46.2% |
| 3+1 | 75 | 140 m² | 10,500 m² | 23.1% |
FINANCING · INVESTMENT REVIEW
Equity performance and sensitivity
Illustrative results use the same selected land price and financing calculation as the Turkish sample report. They reflect scenario assumptions, not verified investment returns.
Equity NPV and IRR include the sample debt and interest assumptions. Project profit is before financing; project NPV shown above is unlevered. Payback counts model periods, including the first period.
Illustrative investment thresholds
| Indicator | Result | Sample threshold | Comparison |
|---|---|---|---|
| Equity IRR | 38.6% | At least 18.0% | Meets threshold |
| Equity NPV | USD 39,913,502 | At least USD 0 | Meets threshold |
| Project profit margin | 36.9% | At least 25.0% | Meets threshold |
| Equity payback | 4 model periods | No more than 6 model periods | Meets threshold |
Equity cash flow
| Year | Debt draw | Interest | Principal repaid | Equity cash flow | Cumulative equity |
|---|---|---|---|---|---|
| 2027 | USD 27,722,016 | USD 0 | USD 0 | USD -29,195,496 | USD -29,195,496 |
| 2028 | USD 0 | USD 2,217,761 | USD 0 | USD -14,605,289 | USD -43,800,785 |
| 2029 | USD 0 | USD 2,217,761 | USD 19,024,711 | USD 0 | USD -43,800,785 |
| 2030 | USD 0 | USD 695,784 | USD 8,697,305 | USD 65,369,398 | USD 21,568,613 |
| 2031 | USD 0 | USD 0 | USD 0 | USD 56,050,000 | USD 77,618,613 |
Equity NPV sensitivity
Rows change development costs; columns change revenues. Land value remains fixed. Values are equity NPV in USD and retain the sample financing assumptions.
| Cost / revenue | -10% | -5% | 0% | +5% | +10% |
|---|---|---|---|---|---|
| -10% | USD 31,887,381 | USD 39,971,181 | USD 48,054,981 | USD 56,144,997 | USD 64,322,375 |
| -5% | USD 27,816,642 | USD 35,900,442 | USD 43,984,241 | USD 52,068,041 | USD 60,171,505 |
| 0% | USD 23,745,903 | USD 31,829,702 | USD 39,913,502 | USD 47,997,302 | USD 56,081,101 |
| +5% | USD 19,675,163 | USD 27,758,963 | USD 35,842,763 | USD 43,926,562 | USD 52,010,362 |
| +10% | USD 15,604,424 | USD 23,688,224 | USD 31,772,023 | USD 39,855,823 | USD 47,939,623 |
INVESTMENT REVIEW · REPRESENTATIVE SCENARIO
Investment decision and risk matrix
This illustrative decision summary uses the same financial model, thresholds and risk assumptions as the Turkish sample report.
The decision score weights financial performance at 75% and the risk matrix at 25%; it is distinct from the ConceptLab Investment Score. Risk levels below are sample assumptions, not verified risk findings. Payback counts model periods, including the first period.
Illustrative risk matrix
| Risk category | Sample level |
|---|---|
| Planning, legal and ownership | Moderate |
| Market, pricing and sales pace | Moderate |
| Construction costs and supply | Moderate |
| Financing and liquidity | Moderate |
| Technical studies and permits | Moderate |
| Operations and delivery | Low |
The financial thresholds and equity cash flow are shown in the financing section above. The scenario is not investment advice; planning, ownership, technical, market and financing assumptions require independent verification.
SITE ACCESS · REPRESENTATIVE DATA
Transport and nearby amenities
Distances and destinations are sample assumptions, not measurements or verified points of interest.
| Illustrative destination | Category | Distance |
|---|---|---|
| Rail connection | Transport | 700 m |
| Transit stop | Transport | 250 m |
| Ferry terminal | Transport | 1,100 m |
| Main road connection | Transport | 1,800 m |
| Interchange | Transport | 2,400 m |
| Airport connection | Transport | 38,000 m |
| Waterfront park | Nearby amenity | 400 m |
| School | Nearby amenity | 850 m |
| Health centre | Nearby amenity | 1,200 m |
| Retail street | Nearby amenity | 600 m |
| Cultural centre | Nearby amenity | 1,500 m |
| Sports facility | Nearby amenity | 950 m |
| Waterfront promenade | Nearby amenity | 450 m |
| Business district | Nearby amenity | 3,200 m |
INFRASTRUCTURE · REPRESENTATIVE DATA
Indicative utility screening
These are assumptions entered for the sample, not utility-provider confirmations. Costs and timeframes require separate verification.
| Utility | Connection assumption | Capacity assumption | Distance | Indicative cost | Duration |
|---|---|---|---|---|---|
| Water | Existing (assumed) | Adequate (assumed) | 60 m | USD 90,000 | 3 months |
| Wastewater | Existing (assumed) | Adequate (assumed) | 60 m | USD 90,000 | 3 months |
| Electricity | Connection required | Limited | 180 m | USD 280,000 | 6 months |
| Natural gas | Existing (assumed) | Adequate (assumed) | 60 m | USD 90,000 | 3 months |
LAND PURCHASE · SCENARIO COMPARISON
Compare land price alternatives
Three land-value assumptions are evaluated using the same scenario calculations as the detailed Turkish sample. All figures are illustrative and are not an appraisal or offer.
| Alternative | Land value | Project profit | Equity NPV | Equity IRR |
|---|---|---|---|---|
| Indicative market value | USD 44,727,693 | USD 80,022,227 | USD 37,293,117 | 36.2% |
| Maximum affordable price | USD 68,699,920 | USD 56,050,000 | USD 14,263,967 | 19.7% |
| Investor purchase price | USD 42,000,000 | USD 82,749,920 | USD 39,913,502 | 38.6% |
The maximum price is calculated using the sample's 25% revenue-based developer-profit reserve. Equity results reflect the sample financing assumptions and differ from unlevered project NPV. The market signal is based on illustrative sample data.
INFRASTRUCTURE · REPRESENTATIVE SCENARIO
Indicative utility demand
The sample uses area-based assumptions to illustrate early screening; these are not utility-provider capacity calculations or official design standards.
Demand assumptions by use
| Use | Saleable area | Water · L/m²/day | Electricity · W/m² |
|---|---|---|---|
| Residential | 30,000 m² | 3 | 25 |
| Office | 10,000 m² | 1.5 | 35 |
| Street retail | 6,800 m² | 2 | 45 |
Utility availability, connection requirements and capacity must be confirmed with the relevant providers. Illustrative connection costs are not automatically added to the project cash flow; check for overlap with site-work allowances.
08 · OPPORTUNITY POOL
Compare illustrative alternatives
Three representative scenarios from the same sample data, using the application's opportunity comparison calculation.
Data readiness reflects available inputs and whether the base-model NPV is positive; it is not the ConceptLab Investment Score. The pool's unlevered NPV and IRR use the base model excluding land value; the detailed project overview above includes the selected land price. The figures therefore serve different comparisons.
Mixed-use scenario
Data readiness100%
Saleable area46,800 m²
NPV · land excludedUSD 79,791,814
IRR · land excluded88.8%
Official zoning, ownership and encumbrance checks are not completed in this illustrative example.
Residential scenario
Data readiness100%
Saleable area46,800 m²
NPV · land excludedUSD 79,397,341
IRR · land excluded87.8%
Official zoning, ownership and encumbrance checks are not completed in this illustrative example.
Office scenario
Data readiness100%
Saleable area46,800 m²
NPV · land excludedUSD 43,359,913
IRR · land excluded56.9%
Official zoning, ownership and encumbrance checks are not completed in this illustrative example.
Explore the full sample
The full interactive report is currently in Turkish. This English overview presents the sample opportunity comparison and selected report sections; it is not a translation of every report page.
Open full sample report (Turkish) →Return to English home →